 sciencedrawings
Every diagram you find for your presentation is watermarked, blurry or black and white. Here is what to do instead.
November 7, 2026
You have a presentation due. You know exactly which diagrams you need. Forty minutes later you are still in Google Images, and every result is either stamped with a watermark, too blurry to project, or a grey scan from a textbook printed decades ago.
It is one of the most common stories we hear. A medical student finishes a general surgery placement and their supervisor asks for a short presentation on the procedures they saw: a laparoscopic appendicectomy, a laparoscopic cholecystectomy, a laparotomy. The content is easy. The pictures are not. A biology teacher building a lesson on cells hits the same wall, and so does anyone making slides for a lab meeting.
Why the search results let you down
- Watermarks. Most of the polished diagrams at the top of image search are previews from stock sites. The clean version costs money and comes with a licence you have to read.
- Blur. Image search often serves a small thumbnail. It looks fine in the results and turns to mush when it fills a projector screen.
- Black and white. Many anatomy and science figures online are scans of old printed textbooks. They were never meant to be read from the back of a lecture theatre.
- No two match. Even when you find three good diagrams, they come from three different places, in three different styles and colour schemes. The deck looks like it was made by three different people.
- Unclear rights. A diagram on a random website rarely says whether you may reuse it, and "I found it on Google" is not a licence.
What a presentation-ready diagram needs
- Resolution or, better, vectors. At least 1400 pixels wide for a slide, or an SVG, which stays sharp at any size.
- Labels you control. Labels baked into a picture cannot be moved, translated or hidden for a quiz. A labeled and a blank version of the same diagram covers teaching and testing.
- One style across the deck. The same outline weight, the same colour palette, the same label boxes, from the first slide to the last.
- A clear licence. Something that says plainly you can use it in slides, handouts and talks.
Where to get diagrams like that
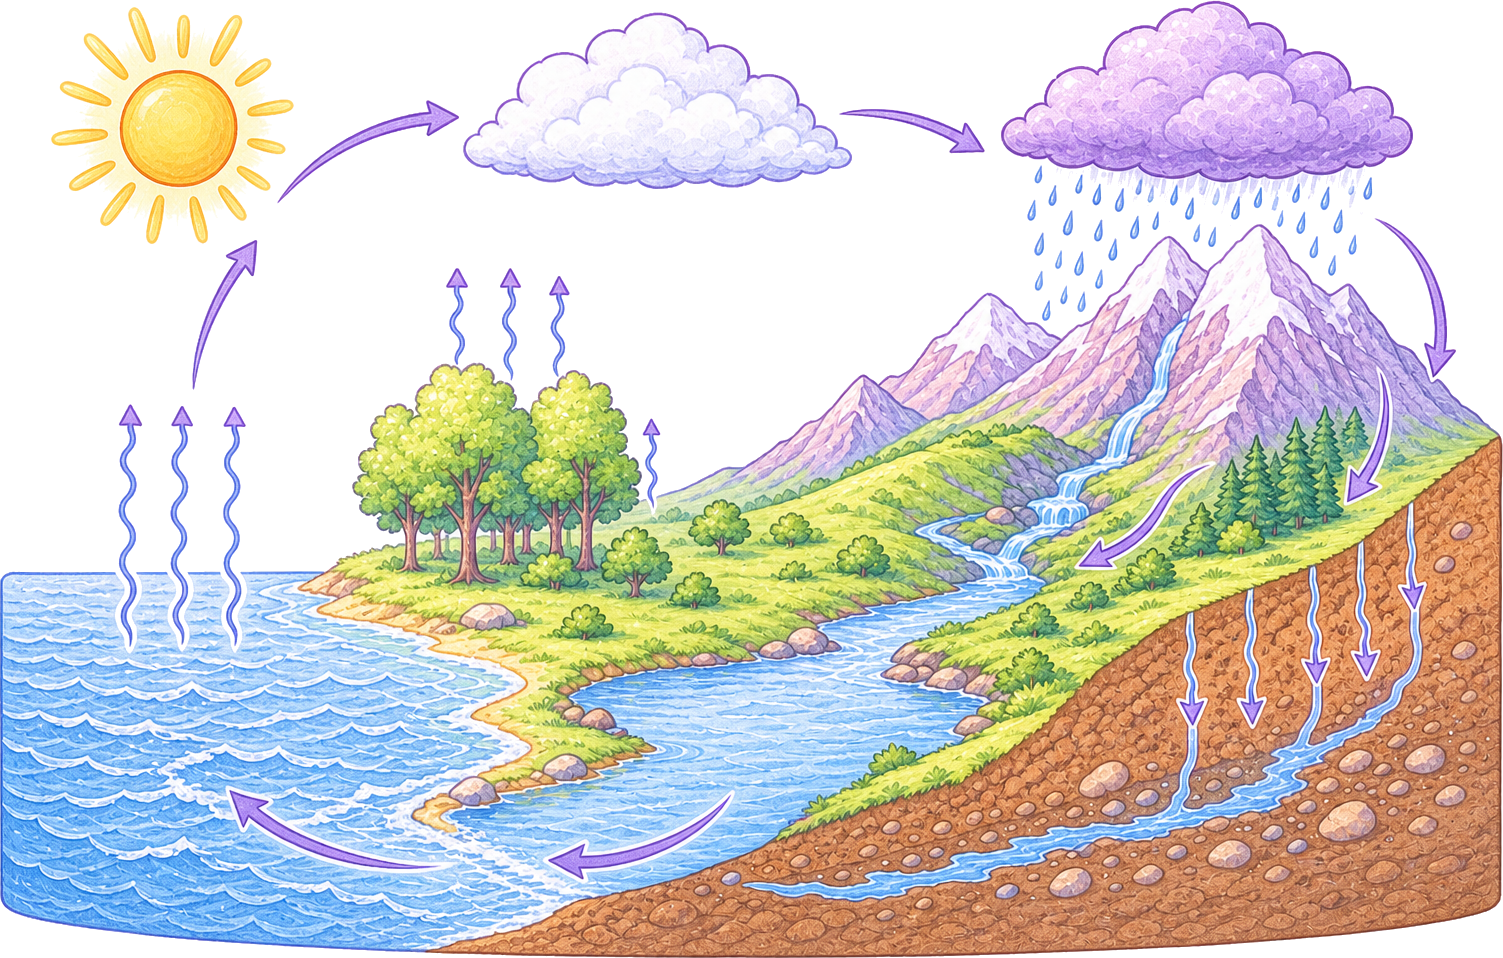
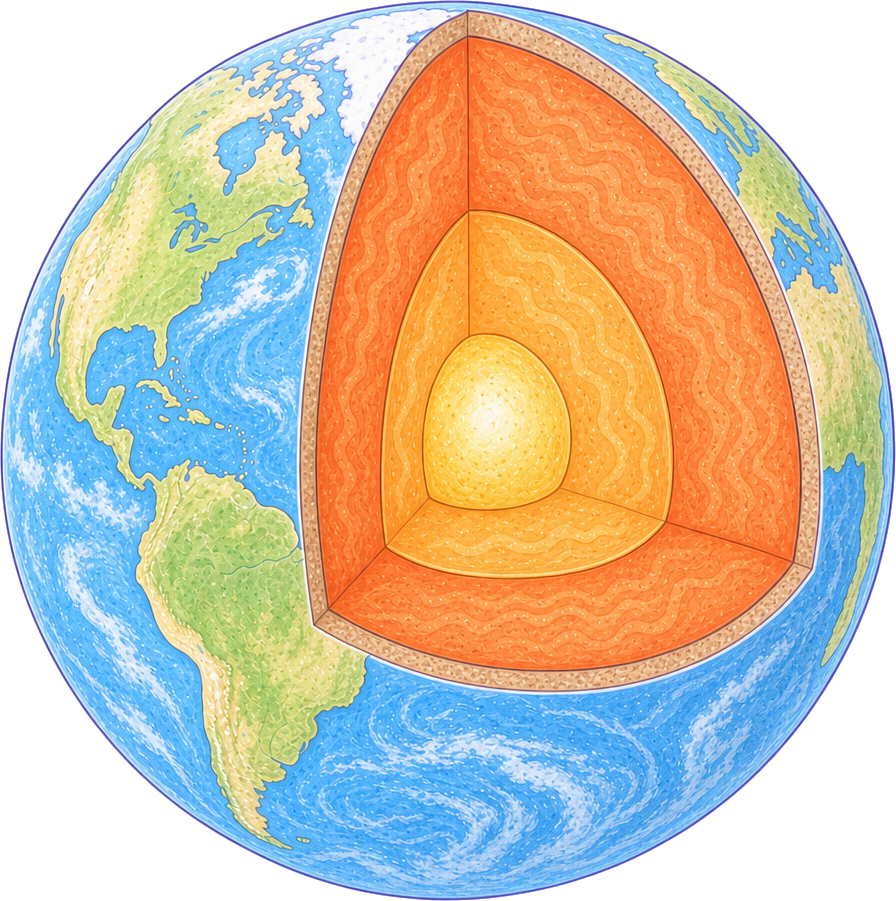
For school and early university science, that is what sciencedrawings.com is for. Every diagram, from the animal cell and plant cell to the water cycle and parts of a flower, comes labeled and blank (many also as the drawing alone), in PNG, high-resolution PNG and SVG, with no watermark and no sign-up. They are free for personal and commercial use, including slides you present at work. They are drawn to sit together, so a cell, a flower and a water cycle look at home in the same deck.
For medical and surgical illustrations, which we do not draw yet, look for libraries made for the purpose and read their terms. Servier Medical Art, for example, offers medical illustrations under a Creative Commons Attribution licence, which means you can use them as long as you credit the source. Wikimedia Commons has many anatomical figures too, but the licence differs from file to file, so check each one.
Making your own is a good option when nothing fits. AI image tools can now produce a clean first draft of a procedure or a structure in minutes. Treat that as a draft: check every structure against your textbook or ask your supervisor, because a confident-looking drawing can still put something in the wrong place. Keep the words out of the generated image and add the labels as text in your slides instead, so you can fix a spelling or a term without regenerating the picture.
Make three diagrams look like one deck
- Pick a palette first. Three or four colours for structures, one for labels, one for highlights. Recolour anything that does not fit.
- Use SVG where you can. An SVG is made of shapes, so changing a colour is a click rather than a repaint.
- Same label style everywhere. Same font, same size, same box. Nothing makes a deck look stitched together faster than three label styles.
- Same framing. Similar size on the slide and similar white space around each figure.
Editable beats a picture of a diagram
The best trick is to bring diagrams in as SVG. In recent versions of PowerPoint (Microsoft 365) you can insert an SVG and choose Convert to Shape; each part of the drawing becomes its own shape that you can recolour, move apart for an "exploded" view, or animate one structure at a time. Google Slides does not accept SVG files, so use the high-resolution PNG there instead. Keep your labels as slide text on top, and the same slide works with labels for teaching and without them for a quick quiz.
Turn the diagram into a quiz
Once your audience has seen the labeled version, test them on the blank one. Every labeled diagram on sciencedrawings.com has a free labeling quiz under it: drag each label to its place, with a score at the end. It also prints as a worksheet with a word bank and an answer key, which saves another forty minutes the night before.
A checklist before your next presentation
- No watermarks, and a licence that allows what you are doing.
- At least 1400 px wide, or SVG.
- One palette and one label style across every slide.
- Labels as text you can edit, hide or translate.
- Every structure checked against a trusted source.
Start with the free science diagrams: labeled, blank and editable, with nothing to sign up for.